Sorting by total cost
Challenge
Can we add TCO to our product in a way that satisfies user needs, business goals and regulatory expectations.
Solution
Iterate over several potential solutions to measure the impact of adding total cost to the table.
Scope
User research, competitor analysis, wireframing, prototyping, user testing
Context
Mobile phone tariffs are complex for users to compare. On top of minutes, texts & data, there’s differences between handset specs, network speed, the interaction between monthly and upfront costs, and even intangible elements like customer service or network perks.
Our industry regulator, OFCOM, has always felt that displaying or sorting by TCO is a great way to compare tariffs across multiple products. uSwitch has observed that TCO may disproportionately promote the cheapest deals that may not be in the best interest of consumers to purchase.
So far we’ve resisted external pressure to display total cost, however there was a feeling that in the future we may be forced to show or default to TCO by the regulator.
In discussion with OFCOM we decided to run some tests to see what users felt about the visibility of total cost and the impact it may have on our business.
What is TCO?
Total cost of ownership is a way of taking the lifetime costs of a contract and combining them into a single monetary value. This gives customers an indication as to the strength of a deal relative to other similar products.
((monthly cost * contract length) + upfront cost) – cashback/discount
Problem
Users were unable to view, calculate or order product tables by the cost they would pay over the full contract.
OFCOM wants us to try showing TCO on our tables and may force us to if we don’t comply with their wishes.
Objectives
Test an implementation of TCO to see what the impact of a mandated change would be.
Give users a visible, meaningful way to view the full cost of a contract. Add new elements to our product tables without negatively affecting conversion. Satisfy OFCOM’s desire to see more meaningful comparison on our product tables.
Process
What’s the point of this project, split into 3 sections.
Research
We knew from previous research into handset purchasing behavior that roughly 70% of users had a reasonable expectation that total cost was a factor and could potentially be a large number. All users when prompted could guess what the TCO calculation was to a reasonable accuracy.
However users didn’t perceive total cost as a barrier to purchasing, with most being comfortable that the high cost would be offset by the longer, 24 month, contract length.
Competitor analysis revealed that a few competitors display a total cost comparison in some form. These included sorting by monthly cost, total cost or average monthly cost, filtering by total cost and displaying cost breakdowns.
Sort by monthly cost
- Shows the cheapest monthly cost deals first
- Often shows newer phones first
- Promotes phones with a longer contract length, spreading the cost over a longer duration
- Promotes low quality deals (low data (<1GB), high upfront cost (£200+)) to the top of the tables
- Does not surface the total cost calculations
Sort by total cost
- Shows the cheapest cost over the life of the contract first
- Often shows phones with low upfront costs first
- The cheapest TCO phones are often older phones from several years ago
- The large number (£700+) may scare users away from purchasing
- Promotes deals with a shorter contract length, meaning higher monthly costs
Sort by average monthly cost
- Evens out the differences between high monthly and upfront costs
- Shows the cheapest cost over the life of the contract first
- Essentially an identical ordering to total cost
- Never reflects a figure the user will actually pay
- Not clearly defined what types of deal are shown first
- Promotes deals with a shorter contract length, meaning higher monthly costs
- The cheapest average monthly cost phones are often older phones from several years ago
All of these options didn’t take the value of the network into account, or addressed the potential problem of refurbished phones, so I took my findings back to the team to begin iterating on a solution.
Ideation
Using the research I collated, along with input from commercial and marketing, we ran a team inception exploring the potential options for TCO on the website.
We knew the main requirements were to display the total cost of each deal in a transparent and obvious way, along with a cost breakdown and a way to order the table by total cost.
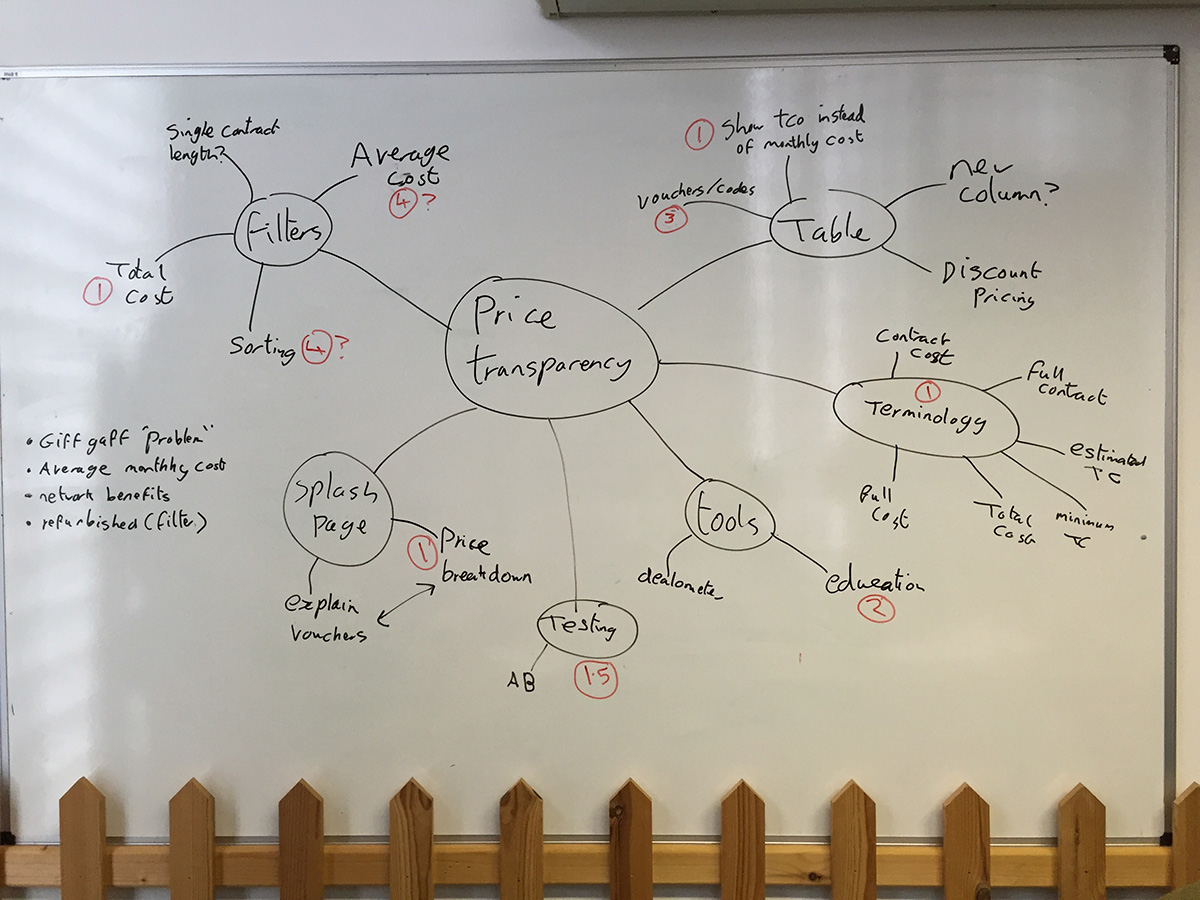
We decided on a series of steps to test:
Step 1: Include the TCO figure on our product tables in some form
Step 2: Add a breakdown of the calculation
Step 3: Allow users to sort the table by total cost
Step 4: Explore other cost options such as average monthly cost
Following these steps would allow us to make rapid iterations and test quickly to benchmark the impact of several potential regulatory changes.
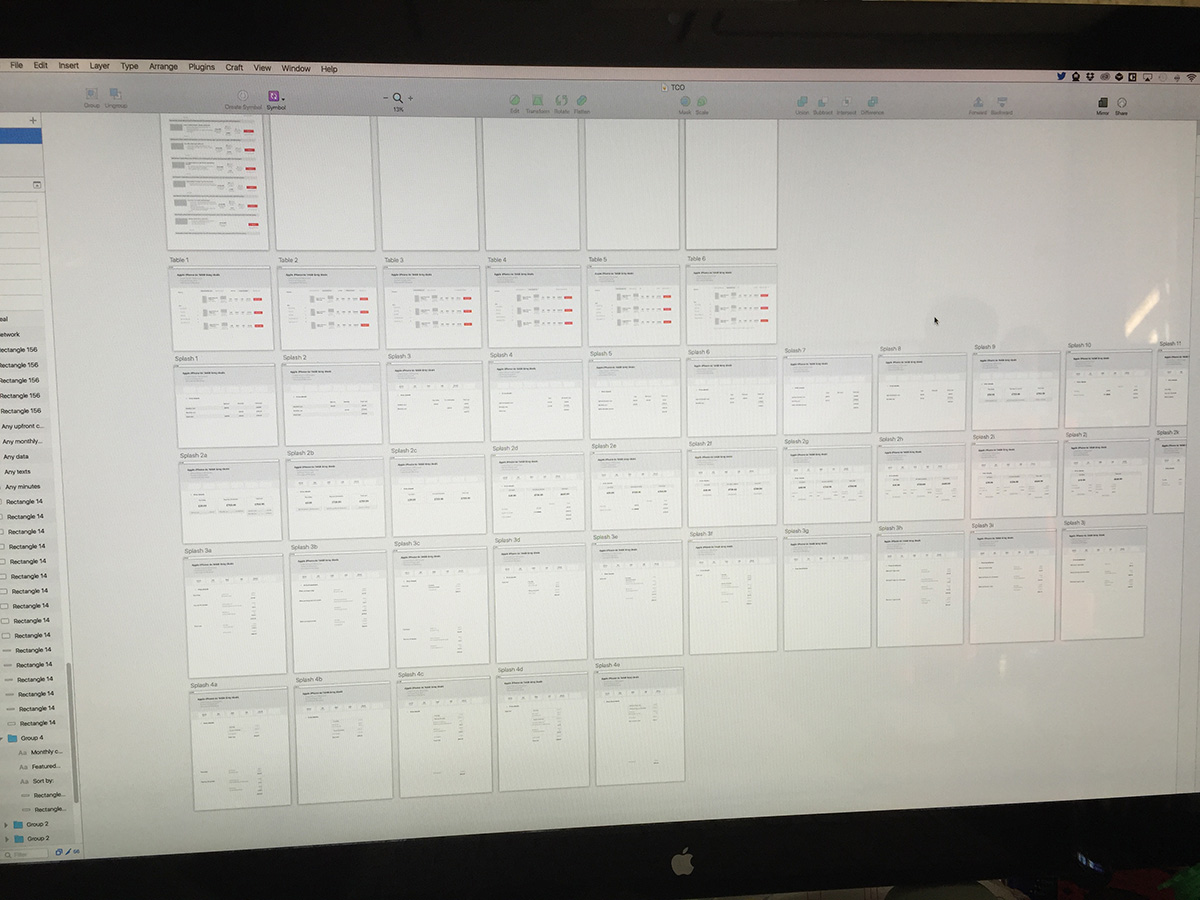
Wireframe
We wanted to take a light-touch approach to the iterations, working from the assumption that the addition of TCO would be a regulatory change rather than one lead by the product.
Showing total cost
We explored ways to add the total cost figure to the table without adding complexity. The tables were already full with content, so there was no room to add an extra column.
Adding total cost as a secondary label underneath monthly cost was agreed as a reasonable first iteration.
Adding a ‘show costs as’ view mode was passed over initially, but considered for later iterations. This was because of some strange interactions where you could potentially view total cost but sort by monthly cost, and the numbers may not match up.

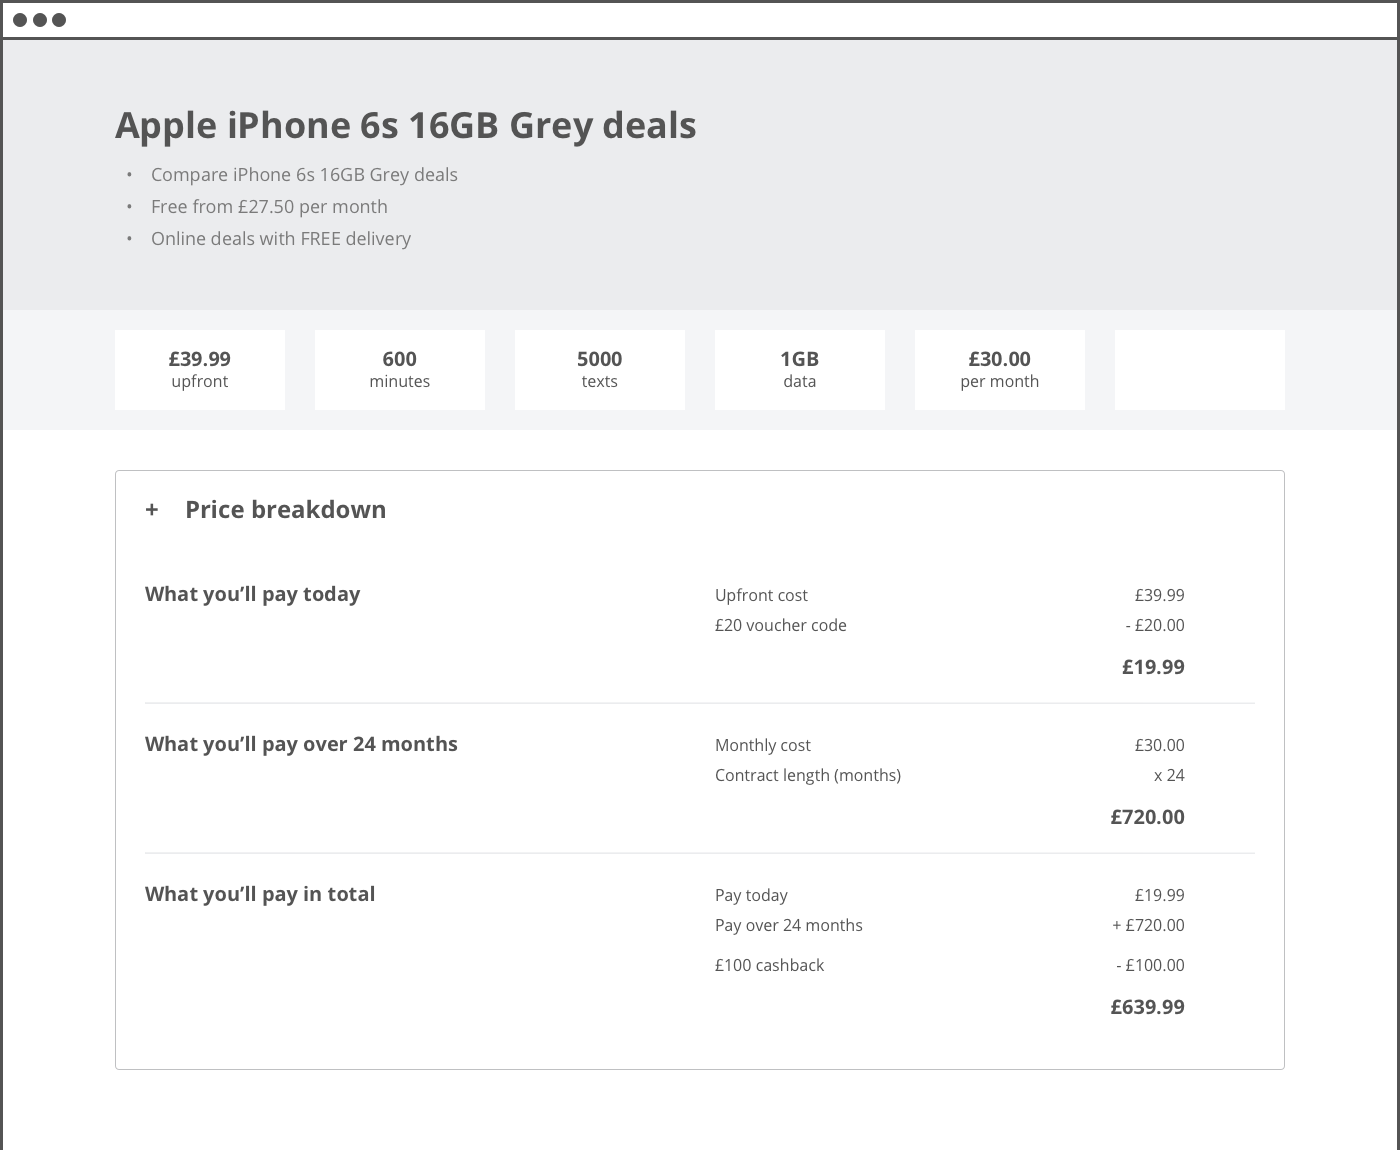
Cost breakdown
Adding the cost breakdowns to the table would have added far too much noise to a page that requires users’ attention, so we decided to use our product splash pages to display TCO. This was effective at allowing the user to get a price breakdown on a single deal and educating them as to how it is calculated.
The TCO calculations were broken down into a familiar itemised list, with sections for ‘pay today’, ‘pay over [contract length]’ and ‘pay in total’.
Cost sorting
The intention was to add sorting by total cost to our sorting options. When selected by the user it would highlight the total cost figure within the table.
Previously we only had two sorting options, so a toggle was used. After adding the third we needed to change to a dropdown input, otherwise the interface around the table became too busy.
We considered keeping a single price figure in the table, changing the monthly cost column to simply “cost”, and adding a “show cost as” toggle, but this adds extra complexity. Because of the interaction between a single cost column and several view options, it’s not inconceivable that a user changes the table view and a particular deal disappears or changes position.
We decided on a version where whichever cost was sorted, that value would be highlighted within the table. We didn’t want to change the position or size of either element, as that may both confuse users, and give prominence to a large value.
Other price options
We felt that adding a third cost figure to the table would make it overwhelming to users. I proposed a price switcher, either sort or view based, that would change the values displayed based on user input.
This would give us the ability to view monthly cost, total cost or average monthly cost, along with sorting by featured deals, monthly cost, total cost and average monthly cost.
However it became clear that in this extreme example the number of variations in the table would be 12 (not including ascending/descending price variants). A number of ‘modes’ far too high for a user to keep track of.
I created a quick prototype to highlight to the team the problem with scaling in our proposed solution. [link to prototype]. We agreed that were we to implement more cost options then a rethink of the whole feature would be required.
We decided as a team to pause this iteration until we had a better idea of the direction to take.
Testing
Our worry that users would see a large number next to every deal and be put off from purchasing was proved to be unfounded in testing. We found that when every deal had a TCO value visible it made any individual cost look less offputting. Plus users liked that they could, albeit manually, use the number to compare several similar deals.
The initial reaction from users was “wow! That’s a large number”. They appeared initially put off by this but, after a few moments consideration, realised that the cost was spread over 24 months and similar for all products in the table.
Total cost breakdown
Users responded positively to the figures laid out on the splash page. They liked that the values were set out in logical pay now, pay later, pay in total steps.
A couple of questions were raised about VAT and RPI price rises, so we added a short disclaimer to make users aware this may occur within the contract.
Sorting by total cost
Users generally reacted negatively after they sorted by total cost. One of the side effects of showing the cheapest first is that it is biased towards older, cheaper phones.
Generally users were looking to find the cheapest way to get this years flagship phone, and unfortunately the tool only allowed them to initially view phones from 1 or 2 years ago.
This was highlighted in testing with one user commenting “you’ve created a time machine for 2 year old phones”.
Some potential solutions could be to include a brand or model filter for users to use, a filter to remove high or low TCO deals, or to include smarter filters that remove older phones.
Despite this overwhelmingly negative feedback, we wanted to test this iteration on the live site. With the understanding that adding total cost sorting in its current form being a forced regulatory change rather than one we implement willingly.
Results
The three steps covered earlier were put live in A/B tests to see what effect they would have on conversion.
The first two tests, showing total cost and showing the cost breakdown, were shown to have no significant effect on conversion. There was a slight dip in clickout, but this was offset by the increase in conversion from sending more qualified customers through to retailers.
Sorting by total cost however had a significant negative effect on conversion on aggregate product pages. We attributed this to the total cost sort enabling cheap, older and less desirable phones to appear at the top of product tables.
Outcomes
We decided to keep showing total cost on the table, along with the cost breakdown on the splash page.
Sorting by total cost was removed, and would not be put live in its current form. We decided to explore this idea again in the future once we have made further improvements to the tables and filters.
We used this opportunity to feed our findings back to OFCOM, using it as an explanation as to why we don’t include total cost sorting by default.